Publication Submission: Future Gas Strategy
Introduction
The Australasian Centre for Corporate Responsibility (ACCR) is pleased to participate in the Future Gas Strategy consultation process.
ACCR is a philanthropically-funded, not-for-profit, research and shareholder advocacy organisation, focused on the investment risks and opportunities brought about by the global energy transition. We closely monitor how climate-related risks are being managed by a selection of heavy-emitting companies, and we enable institutional investors to engage effectively with these companies.
In our submission, we have addressed questions relating to: the role of Australian LNG in decarbonisation, energy security and affordability in our region; domestic gas security; and the contribution of the gas industry to the Australian economy.
- Role of Australian LNG in the region: We see a diminishing and limited role of LNG in the decarbonisation, energy security and affordability of our trading partners. This is because our trading partners are significantly reducing the amount of gas in their energy mixes in favour of renewables and nuclear, as well as by pursuing demand reduction and energy efficiency policies. These are structural shifts driven by energy policy in our major LNG export markets, particularly Japan, Korea and China. Large volumes of new, lower cost LNG supply from Qatar and the US due to enter the market from 2025 will make Australian LNG even less important to our trading partners. Indeed, under the IEA’s Announced Pledges Scenario (APS), required Australian gas production has fallen by over 30% in the last two years. The IEA also now projects that gas demand will peak by 2030 in APS, STEPS and NZE scenarios. Australian gas industry projections for demand are generally far more bullish and not aligned with the IEA’s NZE or APS (a 1.7C scenario) pathways.
- Domestic gas security: Our analysis shows that implementing policy mechanisms that require new LNG contracts to guarantee sufficient domestic supply would help greatly in minimising projected gas shortfalls on the east coast market. Current LNG export contracts for Queensland operators expire from 2034 onward. Requiring new contracts to ensure sufficient domestic supply would reduce gas shortfalls projected by AEMO by over 75%. The remaining, medium-term shortfall would be relatively small and could likely be eliminated with a combination of policies to improve energy efficiency, reduce demand and bolster infrastructure for gas storage and transportation. This would help accelerate the already declining demand for gas, as reflected in AEMO’s annual gas demand projections, which have fallen around 300PJ over the past five years. We believe these supply- and demand-side measures could ensure domestic gas security is maintained without needing to develop new gas fields, which would place further pressure on emissions reductions targets but not secure sufficient gas for the domestic market.
- LNG industry’s economic contribution: We note that the LNG industry’s contribution to the Australian economy is limited and often overstated by the industry. Being majority-owned by foreign corporations means most profits go overseas. The LNG industry also contributes little through tax: it pays only 0.5% of total disclosed corporate tax, and pays a smaller fraction of taxable income as tax than the average Australian company.
We have responded to consultation questions 14, 24, 37 and 39. We would be happy to discuss our submission with the Future Gas Strategy Taskforce at any time in the future.
Response
14. How can Australian LNG accelerate global decarbonisation without compromising energy security or affordability?
Diminishing role for gas exports to support security, affordability and decarbonisation
Gas, and with it LNG, will play a diminishing role in Australia’s and the world’s net-zero transformation. The 2023 International Energy Agency (IEA) World Energy Outlook sees demand for gas decline by 2030 in all scenarios: Stated Policies Scenario (STEPS), Announced Pledges Scenario (APS) and the Net Zero Emissions by 2050 Scenario (NZE).
Chart 1: IEA forecasts global gas demand to decline in all scenarios from 2030
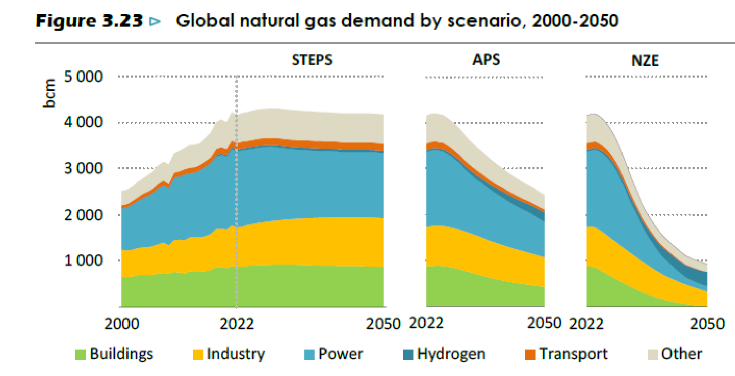
Source: IEA World Economic Outlook 2023, p136
IEA projections for gas demand under the current policy scenarios have been revised downward every year for the last 4 years, suggesting that current demand forecasts could potentially also overestimate actual future demand.
Chart 2: IEA demand projections have been repeatedly revised downward
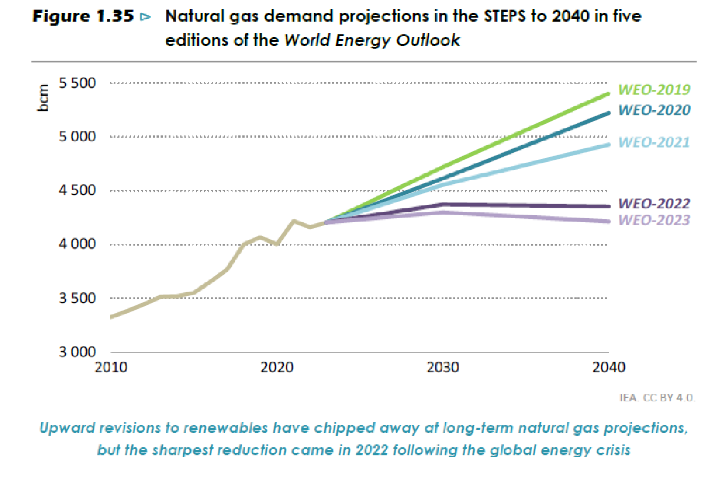
Source: IEA World Economic Outlook 2023, p 77
International Case Studies: Japan and Korea are aiming to significantly reduce gas use
The 2023 WEO forecasts Japan and Korea’s demand for gas will halve by 2050 under the STEPS scenario and fall by over 75 per cent under the APS scenario. This is highly significant for Australia given both have been major buyers of Australian LNG: 38% of our LNG export earnings are from sales to Japan (the largest importer of Australian LNG) and 21% are from sales to Korea.[1]
Chart 3: Natural Gas demand in Japan and Korea, 2010-2050
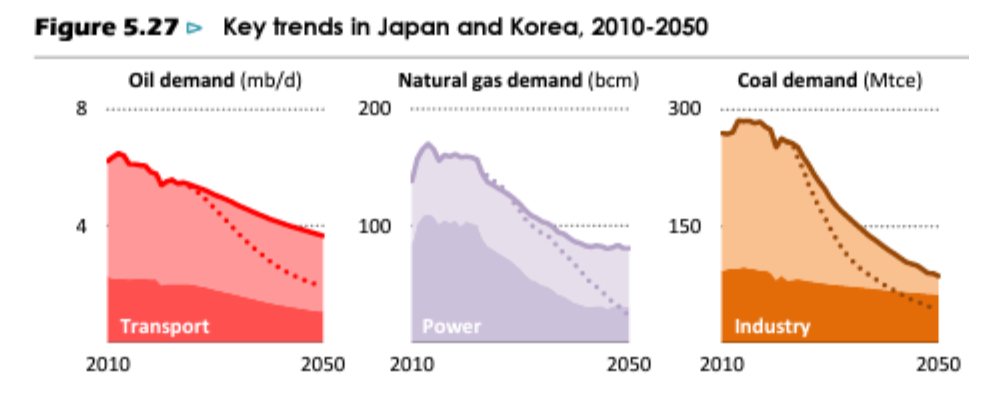
Source: IEA World Economic Outlook 2023, p 246
A variety of policy initiatives in Japan and Korea will shift these countries’ energy mixes away from gas, with the IEA estimating low-emissions technologies will rise from 30% of the energy mix currently to “around 85% by 2050 in the STEPS” scenario.[2]
Japan’s 6th Strategy Energy Plan is a key example of such policy initiatives. Released in October 2021, the Plan saw Japan lift its ambition from 22-24% renewables in its 2030 energy mix to 36-38%.[3] LNG’s share of the energy mix fell from 27% to 20% by 2030 – a significant drop from the 37% in FY2019.[4]
Other key policy initiatives in Japan and Korea that support the shift away from LNG and toward low-emissions technologies include:
Japan
- Basic Hydrogen Strategy, updated in 2023: USD 114 billion over next 15 years, installing 15 GW electrolysers domestically and abroad by 2030.
- Green Transformation Basic Policy: USD 1 trillion (public and private investment) to achieve decarbonisation, energy security and economic growth over next 10 years, aiming to fund renewables and extend the lifetime of nuclear reactors.
Korea
- 10th Basic Plan for Long-term Electricity Supply and Demand: increase renewables, nuclear to 31% and 35% by 2036.
- 1st National Basic Plan for Carbon Neutrality and Green Growth: strengthens power sector emissions reduction targets, with increased roles for renewables and nuclear power.
Australian LNG will also have a diminishing role in Japanese energy security
After the Fukushima Daiichi Nuclear Power Station incident in 2011, Japan increased its reliance on LNG from 29.3% in FY2010 to 42.5% in FY2012.[5] At the time, Australian investments in LNG from 2010 onward were perceived as helping Japan ensure a security and affordable energy system without nuclear power.[6]
However, this role will diminish as Japan looks to increase nuclear and renewables in its energy mix. Japan expects to increase the share of nuclear power in its energy mix to 20-22% by 2030, up from <2% in 2012. The Japanese Green Transformation policy, approved in February 2023, allows nuclear reactors to operate beyond their previous 60-year limit and further enable nuclear power to provide baseload power in Japan. As noted above, renewables are expected to be 36-38% of the energy mix in 2030, up from 1.6% in 2012.
This will cause LNG to fall to 20% of the energy mix in 2030. S&P Global Commodity Insights projects this will result in Japan’s long-term LNG imports halving between 2020-2035.[7]
Chart 4: Japan’s long-term LNG contract are forecast to halve between 2020 and 2035
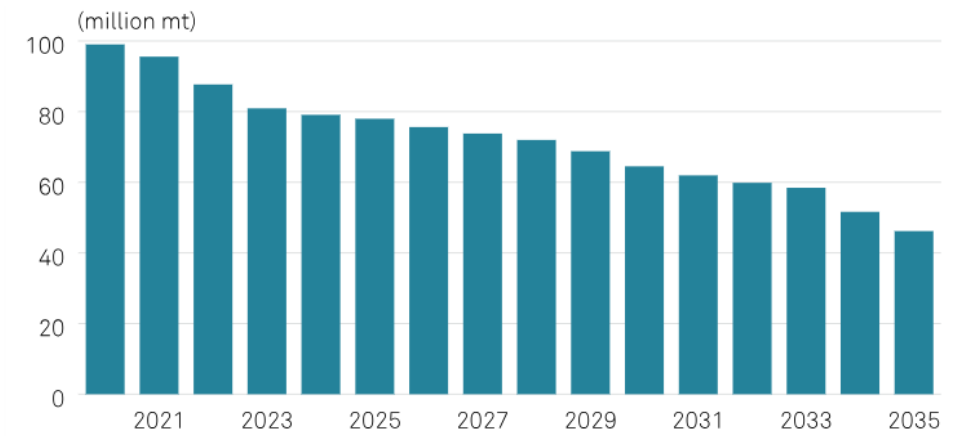
Source: S&P Global Commodity Insights
International Case Study: China
The size of China’s economy is a determinant factor for global energy demand and global emissions. It is well established that its economy is fundamentally changing – both decarbonising rapidly and slowing down economically – which will impact global future energy demand.
China is on track to meet elements of its 2030 NDCs 5 years early, guided by its current 5-year plan (2021-2025), in particular reaching targets of installed renewables in 2025 and peak emissions around 2025.[8]
Under current Chinese policies, coal use is declining in the electricity sector and is replaced by renewables, not gas (Chart 5). Historically gas has not played a significant role in the Chinese electricity grid.
Chart 5: Renewables, not gas, are replacing coal in Chinese electricity generation
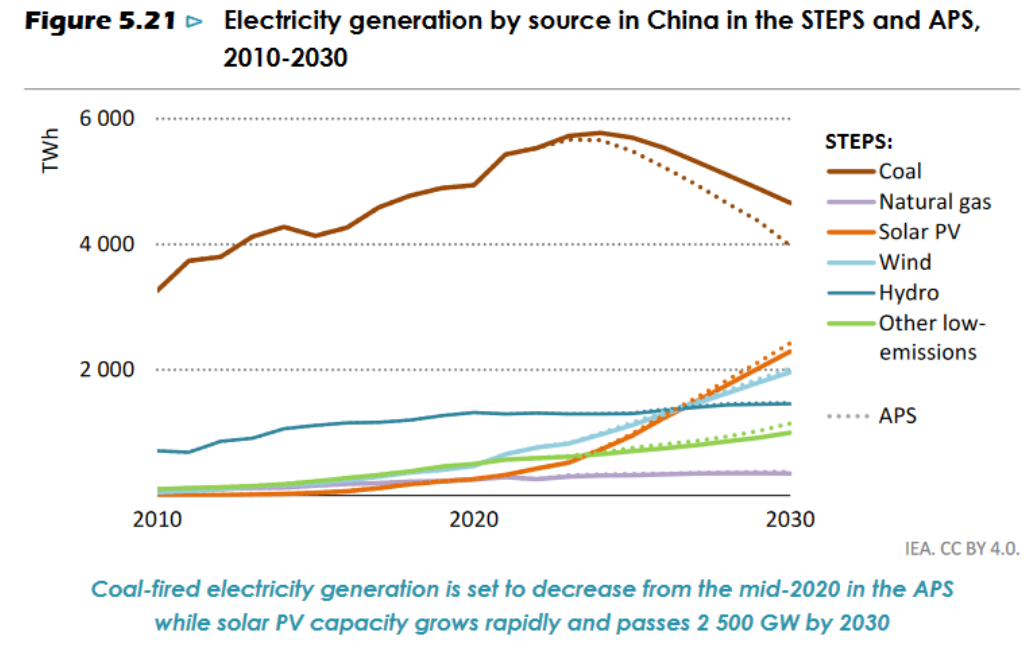
Source: IEA World Economic Outlook 2023, p 239
If China strengthens existing policies to meet all its NDC pledges and long-term targets, the country's fossil fuel demand will decline sooner and faster. With gas declining under all IEA scenarios from 2030 at the latest, China may not need around a third of the LNG it has already contracted.
New LNG supply from 2025 will also reduce the role of Australian gas globally
Between 2025 and 2030, global LNG supply is expected to increase by almost 50%, primarily due to increased capacity in the US and Qatar.[9] This will further reduce our trading partners’ reliance on Australian LNG.
IEA analysis confirms the shifting supply and demand dynamics in regional gas markets has significantly reduced the role of Australian gas in just the past two years. The IEA projects that required Australian gas production under the Announced Pledges Scenario (APS) from 2030-2050 has fallen 31% in the last two years, from 3,541 bcm to 2,431 bcm.[10] This undercuts claims made by the Australian oil and gas industry, that Australian gas has a critical and growing role for regional energy security.
Industry forecasts appear inconsistent with APS, NZE scenarios
Gas exporters in Australia often predict a large supply-demand gap emerging. These forecasts rely on demand forecasts that are far more bullish than the IEA, and are not aligned with the IEA’s NZE or APS (1.7C, not Paris aligned) scenarios. For example, Chart 6 illustrates an example from a Woodside forecast.
Chart 6: Woodside’s demand forecast is not NZE-aligned and regularly focuses on demand based on a 2C+ world
Source: Woodside Half-year Results Briefing 2023 June 2023, pg12
In summary, Australia’s Future Gas Strategy should not include new gas expansion in Australia given: the greatly reduced role our LNG exports will have in providing energy security and affordability to trading partners; their reduced profitability in the face of much higher global supply; and their limited and falling value for trading partners in decarbonisation plans.
24. What are some of the opportunities for gas production in Australia in the medium (to 2035) and long term (to 2050)? How could these necessary developments support decarbonisation consistent with achieving emissions reductions goals?
As the section below demonstrates, there is little need or opportunity for new gas production in Australia. This is due to the current reserves, falling domestic demand and a diminishing role for LNG in regional energy security and decarbonisation. Australia would be better served by pursuing policies that further reduce domestic gas demand, enhancing transport and storage infrastructure for gas, and encouraging investment in renewables and storage, which have both stronger economic prospects and climate credentials.
39. What are the risks to Australia’s domestic gas security in the medium (to 2035) to long term (to 2050) for your industry and how can these be addressed?
Medium and long term domestic gas security can be secured by strengthening policies to reduce demand, modifying export regulations and improving infrastructure.
AEMO has projected a shortfall in gas for Australia’s southern states from 2027, with a cumulative shortfall of 1,271PJ through to 2042.[11] ACCR analysis below, conducted for this submission, shows that the federal government could play a role in ensuring new future LNG export contracts first consider domestic gas requirements, which could reduce AEMO’s projected shortfall by over 75%. This would also help correct the long term demand-supply imbalance of the east coast gas market that was created with the advent of the LNG export industry in 2014, as well as reduce the need for new gas developments. The International Energy Agency has stated that “beyond projects already committed...there are no new oil and gas fields approved for development in our pathway” for net-zero.[12]
Long-term LNG export contracts, which take over two-thirds of gas supply, will expire from 2034 onward. The current high levels of LNG contracted from Shell, Santos and Origin/ConocoPhillips’ LNG facilities have hindered government efforts to direct sufficient gas for domestic use. The regulatory framework should be adjusted so that when these contracts expire it is clear that the first obligation from these facilities is to ensure sufficient domestic gas supply. The operators could then form contracts as they see fit around their primary domestic gas obligation.
Under the Australian Domestic Gas Security Mechanism (ADGSM)/Heads of Agreement, uncontracted gas must first be offered into the domestic market. With renegotiated contracts, the continuation of current gas security policies (and potentially the addition of a national reservation policy) and adequate transport infrastructure would ensure sufficient domestic gas supply to meet southern states' gas demand from 2034. As our analysis below shows, requiring domestic gas considerations first for all new contracts can reduce the projected 2027-42 shortfalls by at least 76%, to 306PJ. This policy would eliminate the artificial scarcity of gas on the east coast market created by LNG exporters in 2014 and prevent shortfalls from 2034 onward.
Demand-side and infrastructure policies can limit the small, remaining shortfall projected for the medium term, 2027-33. Policies like the recent ban on gas connections for new homes in Victoria will have already reduced the shortfall.
Improving Australia’s poor energy efficiency is also an important way we can reduce demand and emissions, while shoring up energy security. Other measures to boost the rollout of renewables, improve gas market flexibility, and optimise pipeline and storage infrastructure will help alleviate shortfalls.
Unlike new gas, these suggested reforms have the dual benefit of improving our energy security and improving alignment with climate goals.
Quantifying the problem: AEMO estimates the shortfall in the southern states at 1,271+PJ
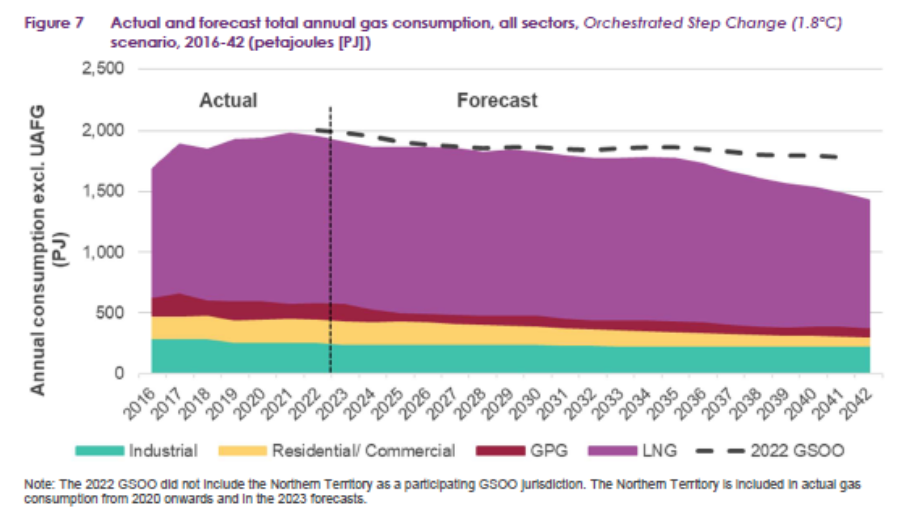
In its March 2023 Gas Statement of Opportunities, the Australian Energy Market Operator (AEMO) forecast a gas supply gap from 2027 to 2042 in the southern states of Australia. AEMO estimated the cumulative supply gap at 1,271PJ. Filling this 2027-42 supply gap with new domestic gas would create an additional 66 MTCO2e of emissions.[13] This is equivalent to the annual emissions of five Eraring Power stations.[14] AEMO’s estimated supply gap of 91PJ for 2042 indicates it also expects shortfalls to persist beyond 2042. Supplying this 91PJ shortfall would generate around 5 MTCO2e p.a. We note, further, that this projected shortfall is quite small relative to the approximately 300PJ fall in demand across AEMO projections in the past five years.
Chart 7: AEMO projects a gas shortfall that is small, dwindling and not certain to eventuate
Source: AEMO: Gas Statement of Opportunities March 2023 - For central and eastern Australia
Below, we examine why Australia – a country with an abundance of gas – faces potential shortfalls in gas, and what practical solutions policy makers have to resolve these shortfalls without needing to approve new domestic gas supply.
The introduction of LNG exports shifted the dynamics of domestic gas market and lead to projected shortfalls
When Queensland-based producers – APLNG, GLNG and QCLNG – began exporting LNG in 2014, they dramatically changed the supply-demand dynamics of the east coast gas market.
LNG producers dominate the east coast gas market. They are both the largest producers and users of gas. The ACCC estimates domestic demand will be only around 27% of east coast gas supply in 2024 (including the use of gas by LNG facilities themselves, which consume more than any other industry and around 10% of the total).[15] Exports for long-term LNG contracts will take over 66% of supply.[16]
Chart 8: Domestic gas shortages are due to high volumes of LNG exports, not natural scarcity
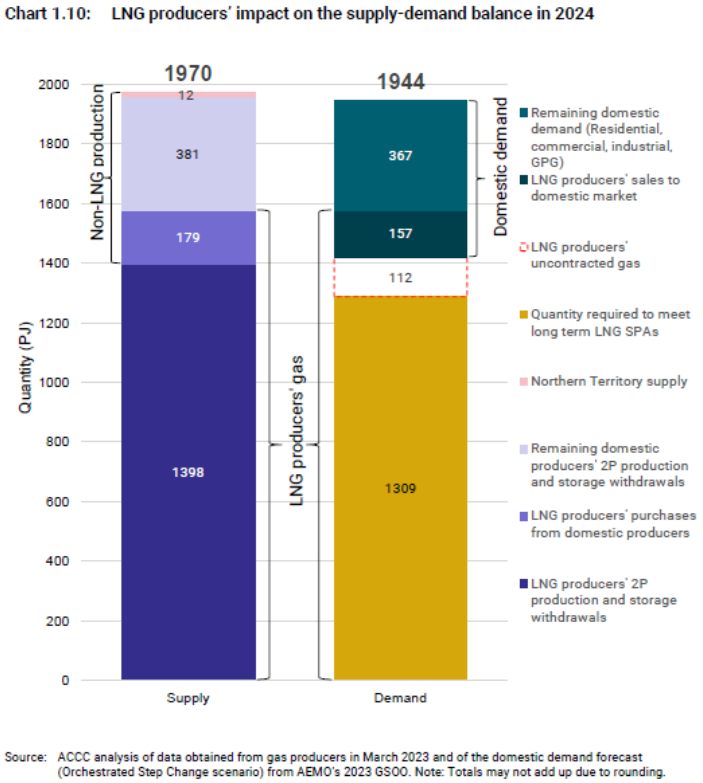
Source: ACCC, Gas Inquiry 2017-2030, June 2023 Interim update on east coast gas market
AEMO forecasts this figure to increase to 73% in 2029 (see Chart 9 below) as LNG export contracts volumes are largely fixed while domestic demand is in decline. These contracts, which began a decade ago, in 2013, are the primary cause of the projected gas shortfalls in the domestic market.
Chart 9: LNG exports to take increasing proportion of gas as domestic demand falls
Source: AEMO, Gas Statement of Opportunities for central and eastern Australia, March 2023, pg24
LNG plants consume more gas than any other domestic sector,[17] and are projected to be taking more than they contribute to the domestic market in order to satisfy their export contracts in 2023 and 2024.[18]
Chart 10: LNG plants projected to detract from available gas for domestic market
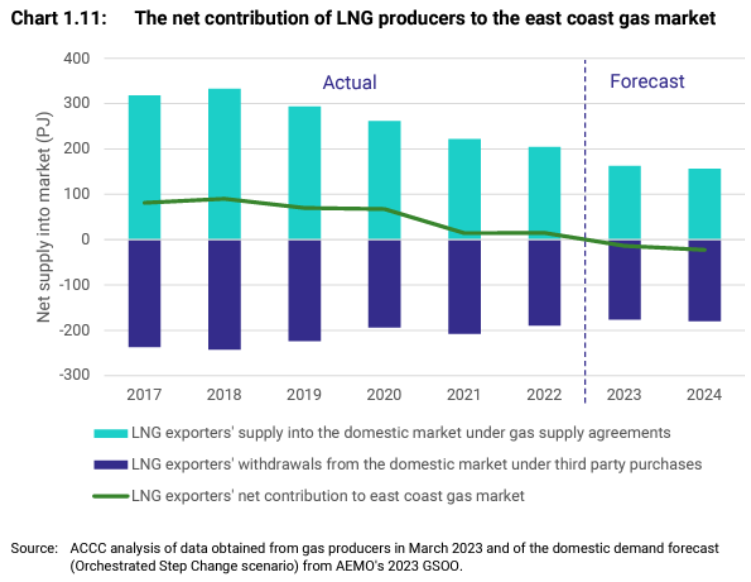
Source: ACCC, Gas Inquiry 2017-2030, June 2023 Interim update on east coast gas market
New LNG contracts offer an opportunity to reduce any shortfall by 76%
From 2034, long-term contracts for Queensland LNG producers will conclude. This means large amounts of gas should become available to the east coast market.
Chart 11: Volumes of Queensland gas under LNG export contract (Mt): 2013-2036
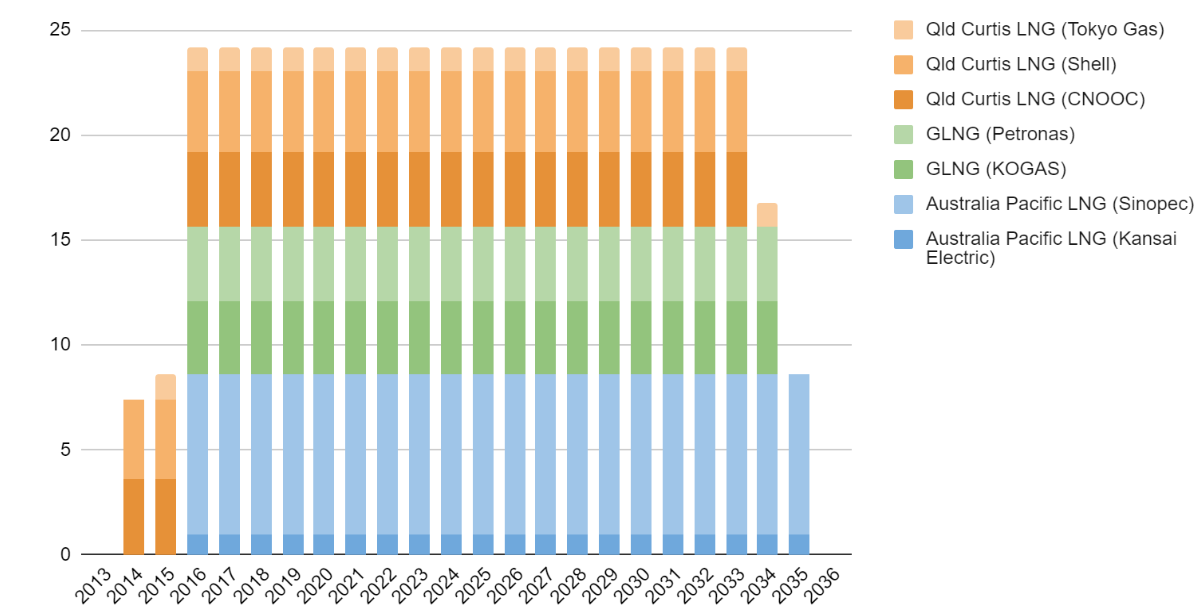
Source: Data from GIIGNL (chart by ACCR)
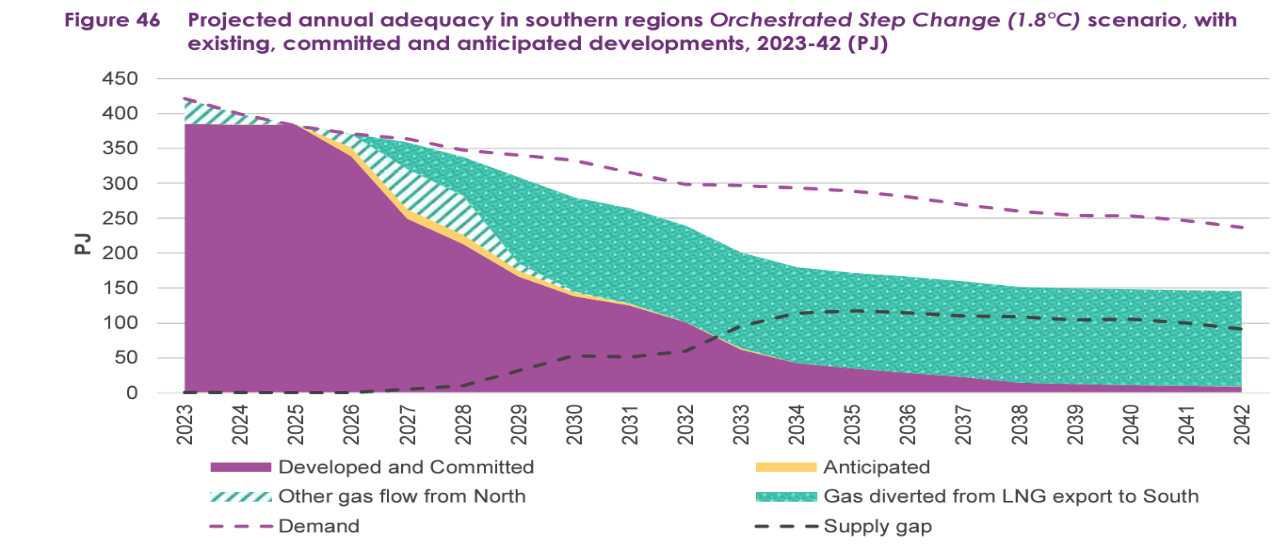
There is an opportunity for a government policy or framework to ensure that the needs of domestic gas users in Australia are met first, before the volume of gas that can be exported by Queensland LNG Producers through new long-term LNG sale and purchase agreements are finalised. This would result in more uncontracted gas for LNG producers that, under the current ADGSM/Heads of Agreement, is required to be offered first into the domestic market. An updated gas policy that considers domestic requirements, applied to new contracts, would significantly limit the size of projected gas shortfalls. AEMO’s projected shortfall of 1,271PJ would fall at least 76% to 306PJ, and would be limited to the 2027-34 time period.[19]
AEMO projects the southern states gas shortfall to peak at 117PJ in 2035. As a comparison, the ACCC forecast that in 2024 LNG producers will supply 1,577PJ of domestic gas, of which 83% is required to meet long-term LNG export contracts. As a guide, if the percentage of 2024 LNG producers' gas supply to meet long-term LNG export contracts was marginally reduced from 83% to 75%, this would free up around 126PJ of gas, which is more than the estimated 117PJ peak shortfall in 2035. This highlights the impact that even minor reductions in the proportion of domestic supply linked to meet new long-term LNG export contracts can have in securing longer term domestic gas energy security in the southern states.
Ensuring the necessary transport infrastructure to transport gas from the north to the south would also help ensure sufficient domestic gas supply to meet southern states gas demand and avoid new long-term export contracts creating artificial domestic scarcity again.
It is also not certain that gas shortfalls projected by AEMO will prove accurate. Gas demand is in steady decline and AEMO demand forecasts have been continually revised downwards, as Chart 12, produced by the Grattan Institute, shows.[20]
Chart 12: AEMO gas forecasts have historically proved too bullish
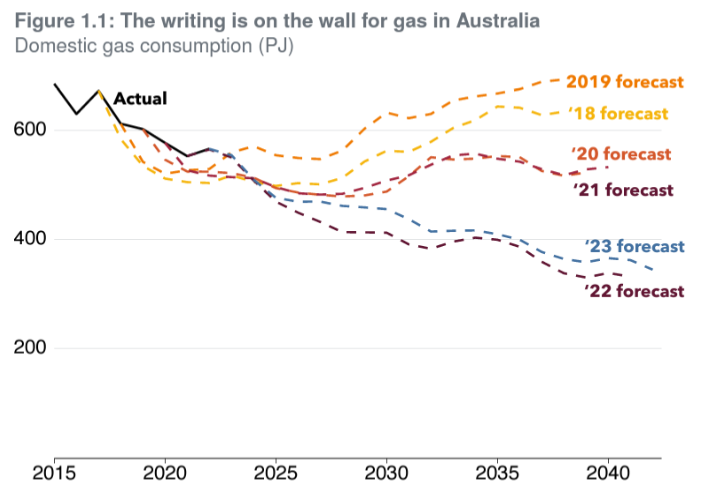
Source: Grattan Institute – ‘Getting off gas’
Other policy options to eliminate shortfall in 2027-2034
Improving energy efficiency more generally would also help reduce demand (and emissions). As AEMO’s CEO noted in June 2023, Australia ranks “18th out of 25 countries for energy efficiency, significantly behind leading European countries like France or the UK, and also behind countries in our own neighbourhood, like India and Indonesia.”[21]
There are a range of other policy options that can help reduce demand, increase market flexibility and avoid projected gas shortfalls for 2027-34. A strong example is the recent move to ban gas connections for new homes in Victoria, the state with the highest gas consumption. Demand reductions stemming from this policy are not factored into AEMO projections. This policy will help alleviate shortfalls and, in the long-run, bring down emissions and consumer energy bills.
Regulators, government departments, private sector consultants, think-tanks, and civil society organisations have put forward various measures to help avoid projected domestic gas shortfalls. These include: government incentives to accelerate the transition from gas to electricity;[22] the greater use of flexible contracts and short term or emergency trading markets;[23] the build out of pipeline and storage infrastructure;[24] and the expansion of green hydrogen and other clean alternatives to gas for industry.[25]
37. How has the oil and gas industry impacted the local economy and employment opportunities in your region?
It should also be noted that the Queensland-based LNG producers are majority foreign owned and, as the table below shows, are often both producer and customer. This means the majority of profits from LNG exports go offshore.
| LNG exporter | Owners | Customers[26] |
|---|---|---|
| Australia Pacific LNG | US: ConocoPhillips (47.5%) Australia: Origin (27.5%) Chinese: Sinopec (25%)[27] Note: Origin’s 27.5% share may shortly be purchased by Canadian firm Brookfield[28] | Chinese: Sinopec (89%) Japanese: Kansai Electric (11%) |
| Gladstone LNG | Australian: Santos (30%) Malaysian: Petronas (27.5%) French: Total (27.5%) S Korean: KOGAS (15%)[29] | Malaysian: Petronas (50%) S Korean: KOGAS (50%) |
| Queensland Curtis LNG | UK: Shell (73.75%) Chinese: CNOOC (25%) Japanese: Tokyo Gas (1.25%)[30] | UK: Shell (44%) China; CNOOC (42%) Japan: Tokyo Gas (14%) |
Despite frequent rhetoric from Australian LNG producers that they are major taxpayers, they contribute just a small fraction of tax from the resources sector.
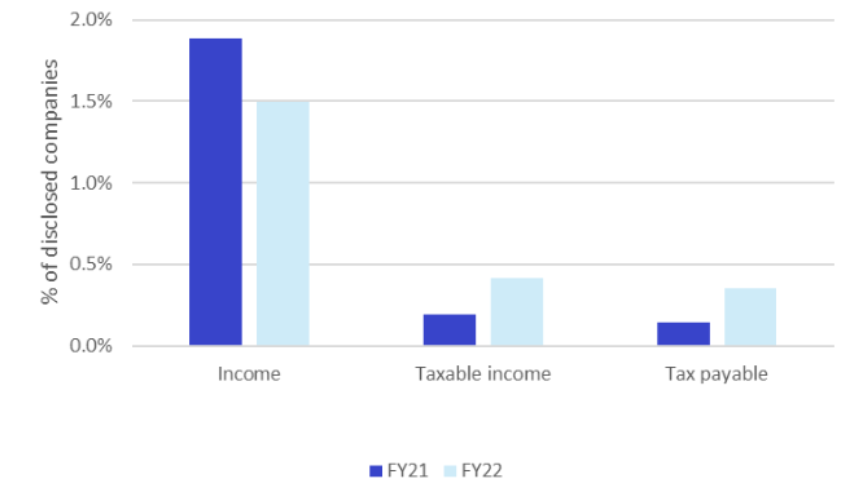
When looking specifically at the companies that own shares in the East coast LNG facilities, they have paid a total of $100 million in tax in FY21 and $296 million in FY22.[31] Chart 13 shows that this is less than 0.5% of disclosed corporate tax and that these companies generate less than 2% of disclosed corporate revenue.[32] Chart 13 also shows that compared to the average Australian company in this data set, these companies pay a smaller fraction of their income as tax, and a smaller fraction of their taxable income as tax. None of these companies paid Petroleum Resources Rent Tax in either FY21 or FY22.
Chart 13: Income and tax attributable to companies that own a share of East coast LNG facilities
It is also important to distinguish between the resources sector generally and the LNG sector. The ATO provides a breakdown of tax payable by industry segment, which shows that in FY22, the ‘Mining, Energy and Water’ sector paid $42.4 billion in tax.[33] This is a large portion of Australia’s corporate tax, but this is driven by BHP and Rio Tinto, who generated $20 billion in tax between them. The companies that own shares in the East coast LNG terminal only contributed 0.7% to this $42.4 billion of tax.
The Australia Institute compiled a briefing note[34] providing additional examples of Australian oil and gas companies that pay little, or no, tax and examples of these companies commissioning reports forecasting significant tax payments that have not eventuated.
Please read the terms and conditions attached to the use of this site.
Drawing on data in table marked “Australia’s export earning in 2022, $b” on p15 of the Future Gas Strategy Consultation Paper ↩︎
International Energy Agency, World Energy Outlook, October 2023, pg246 ↩︎
Outline of Strategic Energy Plan, October 2021, Ministry of Economy, Trade and Industry, pg12 ↩︎
Outline of Strategic Energy Plan, October 2021, Ministry of Economy, Trade and Industry, pg12 ↩︎
Japan’s Fourth Strategic Energy Plan, April 2014, pg90 ↩︎
Hamasaki et al, The Australia-Japan Dialogue – Energy Security: Challenges And Opportunities, Griffith Asia Institute, Regional Outlook Paper: No. 46, 2014 /https://www.griffith.edu.au/__data/assets/pdf_file/0027/118908/Regional-Outlook-Paper-46-Australia-Japan-Dialogue-web.pdf, pp i-ii ↩︎
Japan's green transformation policy to alter LNG contract strategies, S&P Global Commodity Insights, 13 February 2023, https://www.spglobal.com/commodityinsights/en/market-insights/latest-news/energy-transition/021723-japans-green-transformation-policy-to-alter-lng-contract-strategies#:~:text=Japan's green transformation policy to alter LNG contract strategies,-Author Takeo Kumagai&text=Japan's Green Transformation (GX) policy,flexible and shorter LNG contracts ↩︎
International Energy Agency, World Energy Outlook, October 2023, pp 236-238 ↩︎
International Energy Agency, World Energy Outlook 2023, October 2023, pg20-21 ↩︎
International Energy Agency, World Energy Outlook 2021 & 2023, Extended Data Spreadsheets ↩︎
Using AEMO 2023 Gas Statement of Opportunities - report figures and data: https://aemo.com.au/en/energy-systems/gas/gas-forecasting-and-planning/gas-statement-of-opportunities-gsoo and Australian Energy Market Operator, 2023 Gas Statement of Opportunities (GSOO), https://aemo.com.au/-/media/files/gas/national_planning_and_forecasting/gsoo/2023/2023-gas-statement-of-opportunities.pdf?la=en, March 2023 ↩︎
International Energy Agency, Net Zero by 20250, A Roadmap for the Global Energy Sector, pg11 ↩︎
Calculations assume Scope 1 Emission factor (kg CO2-e/GJ) of 51.53 as per the Australian National Greenhouse Accounts Factors pg13 (February 2023) ↩︎
https://www.cleanenergyregulator.gov.au/NGER/Pages/Published information/Electricity sector emissions and generation data/Electricity-sector-emissions-and-generation-data-2020-21-Facility-details.aspx?ListId={CD0E62B3-8EE2-49A6-B2C1-94A5CC8202AA}&ItemID=431 ↩︎
524PJ demand for 1970PJ supply. ↩︎
ACCC, Gas Inquiry 2017-2030, June 2023 Interim update on east coast gas market pg33 ↩︎
https://www.energy.gov.au/sites/default/files/Australian Energy Statistics 2020 Energy Update Report_0.pdf ↩︎
https://www.accc.gov.au/system/files/ACCC Gas Inquiry - July 2022 interim report - FINAL.pdf ↩︎
AEMO: Gas Statement of Opportunities March 2023 - For central and eastern Australia, pg85 ↩︎
https://grattan.edu.au/wp-content/uploads/2023/06/Getting-off-gas-why-how-and-who-should-pay.pdf ↩︎
https://aemo.com.au/newsroom/news-updates/aemo-ceo-speech-at-australian-energy-week ↩︎
https://grattan.edu.au/report/getting-off-gas/; https://www.climatecouncil.org.au/resources/australia-doesnt-need-new-gas-climate-council-responds-aemo-report/; https://www.energy.vic.gov.au/renewable-energy/victorias-gas-substitution-roadmap ↩︎
https://aemo.com.au/-/media/files/gas/national_planning_and_forecasting/gsoo/2023/2023-gas-statement-of-opportunities.pdf?la=en ↩︎
https://aemo.com.au/-/media/files/gas/national_planning_and_forecasting/gsoo/2023/2023-gas-statement-of-opportunities.pdf?la=en; https://www.mckinsey.com/~/media/McKinsey/Featured Insights/Asia Pacific/Meeting east Australias gas supply challenge/Meeting Australias gas supply challenge.pdf; Woodside has also stated its openness to opportunities for LNG imports: https://www.aap.com.au/news/pressure-remains-as-not-much-gas-covered-by-price-cap/ ↩︎
https://aemo.com.au/-/media/files/gas/national_planning_and_forecasting/gsoo/2023/2023-gas-statement-of-opportunities.pdf?la=en ↩︎
GIIGNL data: https://giignl.org/wp-content/uploads/2022/05/GIIGNL2022_Annual_Report_May24.pdf ↩︎
https://aplng.com.au/who-we-are/#:~:text=Australia Pacific LNG is an,%)%20and%20Sinopec%20(25%25) ↩︎
https://cdn-api.markitdigital.com/apiman-gateway/ASX/asx-research/1.0/file/2924-02735008-2A1485097?access_token=83ff96335c2d45a094df02a206a39ff4 ↩︎
https://www.santos.com/news/glng-project-sanctioned/#:~:text=GLNG is a joint venture,%)%20and%20KOGAS%20(15%25) ↩︎
Overall stakes for CNOOC and Tokyo Gas derived from train stakes. Train 1: Shell (50%); CNOOC (50%); Train 2: Shell (97.5%); Tokyo Gas (2.5%).
https://www.shell.com.au/media/2020-media-releases/shell-announces-the-sale-of-a-minority-interest-in-qclng-common-facilities-infrastructure-to-global-infrastructure-partners.html ↩︎These disclosures include public and foreign companies that generate A$100m or more. Based off ↩︎
https://www.ato.gov.au/Business/Large-business/In-detail/Tax-transparency/Corporate-tax-transparency-report-2021-22/?page=7#Five_year_trend_analysis ↩︎
https://australiainstitute.org.au/wp-content/uploads/2022/05/P1256-APPEA-Tax-Briefing-Note-UPDATED-13072022.pdf ↩︎
Publication information
- Published on
Stay informed
Get email updates about new ACCR research and shareholder advocacy on specific topics of interest to you.
We use Mailchimp for email updates and the Mailchimp privacy policy applies.
